

America’s Changing Religious Identity

Executive Summary….
The American religious landscape is undergoing a dramatic transformation. White Christians, once the dominant religious group in the U.S., now account for fewer than half of all adults living in the country. Today, fewer than half of all states are majority white Christian. As recently as 2007, 39 states had majority white Christian populations. These are two of the major findings from this report, which is based on findings from PRRI’s 2016 American Values Atlas, the single largest survey of American religious and denominational identity ever conducted. This landmark report is based on a sample of more than 101,000 Americans from all 50 states and includes detailed information about their religious affiliation, denominational ties, political affiliation, and other important demographic attributes.
Among the major findings:
- White Christians now account for fewer than half of the public. Today, only 43% of Americans identify as white and Christian, and only 30% as white and Protestant. In 1976, roughly eight in ten (81%) Americans identified as white and identified with a Christian denomination, and a majority (55%) were white Protestants.
- White evangelical Protestants are in decline—along with white mainline Protestants and white Catholics. White evangelical Protestants were once thought to be bucking a longer trend, but over the past decade their numbers have dropped substantially. Fewer than one in five (17%) Americans are white evangelical Protestant, but they accounted for nearly one-quarter (23%) in 2006. Over the same period, white Catholics dropped five percentage points from 16% to 11%, as have white mainline Protestants, from 18% to 13%.
- Non-Christian religious groups are growing, but they still represent less than one in ten Americans combined. Jewish Americans constitute 2% of the public while Muslims, Buddhists, and Hindus each constitute only 1% of the public. All other non-Christian religions constitute an additional 1%.
- America’s youngest religious groups are all non-Christian. Muslims, Hindus, and Buddhists are all far younger than white Christian groups. At least one-third of Muslims (42%), Hindus (36%), and Buddhists (35%) are under the age of 30. Roughly one-third (34%) of religiously unaffiliated Americans are also under 30. In contrast, white Christian groups are aging. Slightly more than one in ten white Catholics (11%), white evangelical Protestants (11%), and white mainline Protestants (14%) are under 30. Approximately six in ten white evangelical Protestants (62%), white Catholics (62%), and white mainline Protestants (59%) are at least 50 years old.
- The Catholic Church is experiencing an ethnic transformation. Twenty-five years ago, nearly nine in ten (87%) Catholics were white, non-Hispanic, compared to 55% today. Fewer than four in ten (36%) Catholics under the age of 30 are white, non-Hispanic; 52% are Hispanic.
- Atheists and agnostics account for a minority of all religiously unaffiliated. Most are secular. Atheists and agnostics account for only about one-quarter (27%) of all religiously unaffiliated Americans. Nearly six in ten (58%) religiously unaffiliated Americans identify as secular, someone who is not religious; 16% of religiously unaffiliated Americans nonetheless report that they identify as a “religious person.”
- There are 20 states in which no religious group comprises a greater share of residents than the religiously unaffiliated. These states tend to be more concentrated in the Western U.S., although they include a couple of New England states, as well. More than four in ten (41%) residents of Vermont and approximately one-third of Americans in Oregon (36%), Washington (35%), Hawaii (34%), Colorado (33%), and New Hampshire (33%) are religiously unaffiliated.
- No state is less religiously diverse than Mississippi. The state is heavily Protestant and dominated by a single denomination: Baptist. Six in ten (60%) Protestants in Mississippi are Baptist. No state has a greater degree of religious diversity than New York.
- The cultural center of the Catholic Church is shifting south. The Northeast is no longer the epicenter of American Catholicism—although at 41% Catholic, Rhode Island remains the most Catholic state in the country. Immigration from predominantly Catholic countries in Latin America means new Catholic populations are settling in the Southwest. In 1972, roughly seven in ten Catholics lived in either the Northeast (41%) or the Midwest (28%). Only about one-third of Catholics lived in the South (13%) or West (18%). Today, a majority of Catholics now reside in the South (29%) or West (25%). Currently, only about one-quarter (26%) of the U.S. Catholic population lives in the Northeast, and 20% live in the Midwest.
- Jews, Hindus, and Unitarian-Universalists stand out as the most educated groups in the American religious landscape. More than one-third of Jews (34%), Hindus (38%), and Unitarian-Universalists (43%) hold post-graduate degrees. Notably, Muslims are significantly more likely than white evangelical Protestants to have at least a four-year college degree (33% vs. 25%, respectively).
- Asian or Pacific-Islander Americans have a significantly different religious profile than other racial or ethnic groups. There are as many Asian or Pacific-Islander Americans affiliated with non-Christian religions as with Christian religious groups. And one-third (34%) are religiously unaffiliated.
- Nearly half of LGBT Americans are religiously unaffiliated. Nearly half (46%) of Americans who identify as lesbian, gay, bisexual, or transgender (LGBT) are religiously unaffiliated. This is roughly twice the number of Americans overall (24%) who are religiously unaffiliated.
- White Christians have become a minority in the Democratic Party. Fewer than one in three (29%) Democrats today are white Christian, compared to half (50%) one decade earlier. Only 14% of young Democrats (age 18 to 29) identify as white Christian. Forty percent identify as religiously unaffiliated.
- White evangelical Protestants remain the dominant religious force in the GOP. More than one-third (35%) of all Republicans identify as white evangelical Protestant, a proportion that has remained roughly stable over the past decade. Roughly three-quarters (73%) of Republicans belong to a white Christian religious group.
Religious Diversity
Despite the incredible variety of religious expression and identity in the U.S., there are importance differences in the degree of religious diversity found in each state. To measure the religious diversity in the country, this report uses an index developed to measure variations in the concentration of global religious populations.2 The index is calculated so that a score of “one” signifies complete diversity—every religious group is of equal size—while a score of “zero” indicates a complete lack of diversity and one religious group comprises the entire population of a given state.
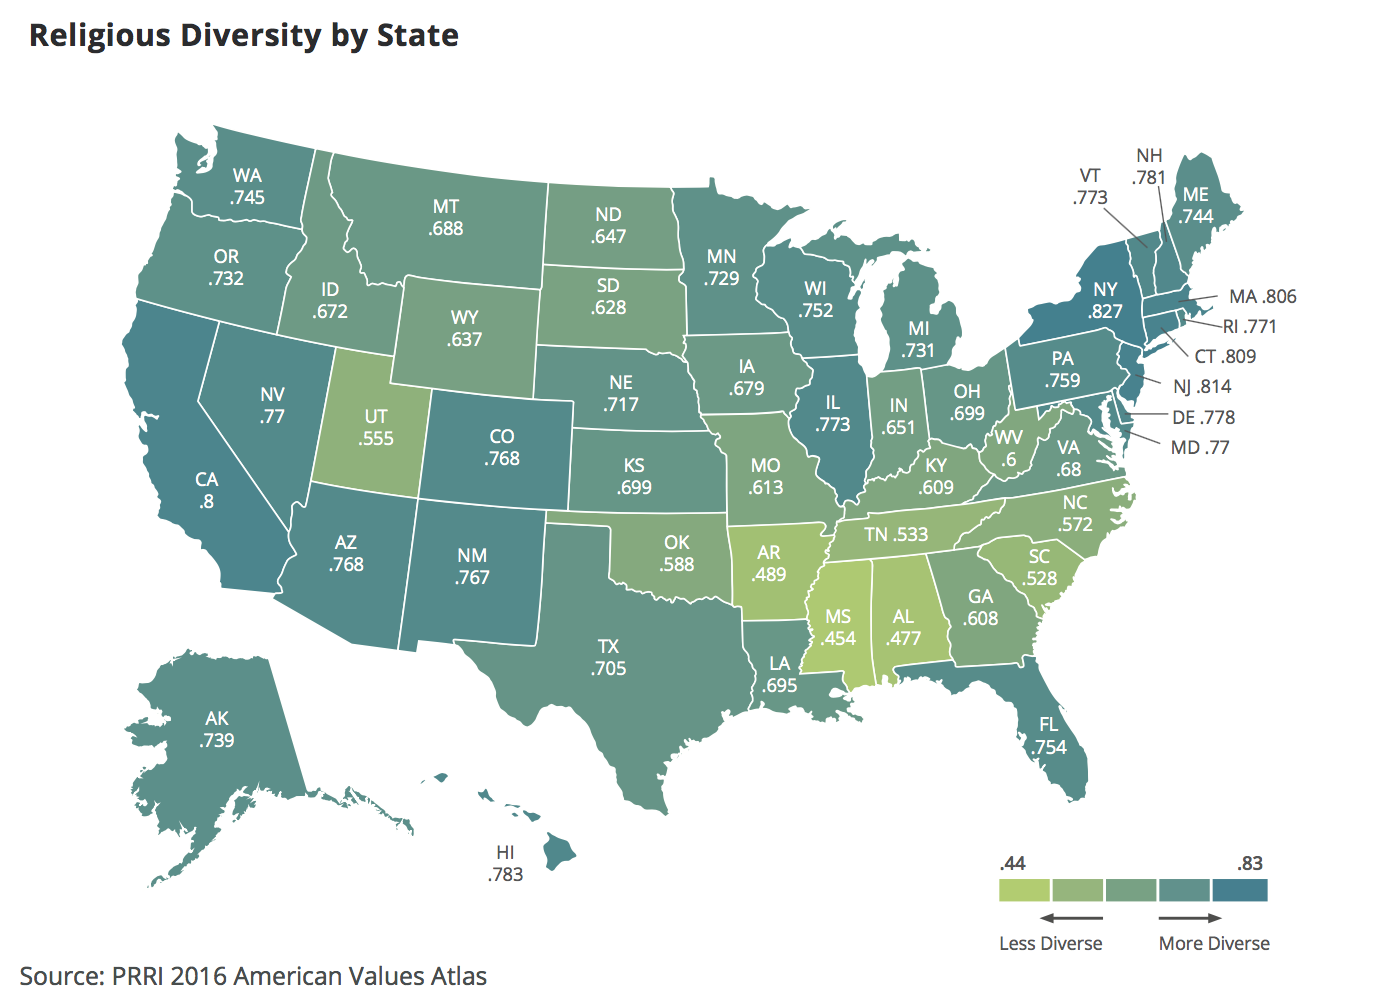
The least religiously diverse states in the U.S. are all located in the South. Mississippi is the least diverse state in the U.S. (0.45), followed by Alabama (0.48), Arkansas (0.49), South Carolina (0.53), and Tennessee (0.53). Conversely, the most religiously diverse states are primarily located in the Northeastern U.S., with New York (0.83), New Jersey (0.81), Connecticut (0.81), Massachusetts (0.81), and California (0.8) registering the greatest degree of religious diversity.
Protestant Denominations
Among Protestants in the U.S., Baptists are the largest denominational family. Roughly one-third (32%) of all Protestants identify with some Baptist denomination, at least three times the number who identify with the next largest denominational families—Methodist (10%), Pentecostal (10%), and Lutheran (8%). One in twenty identify with the Church of Christ or Disciples of Christ (5%) denominations or with the Presbyterian denomination (5%). Only three percent of Protestants belong to an Episcopalian or Anglican denomination. Notably, nearly one in five (17%) Protestants belong to independent Christian churches that are not affiliated with any Protestant denomination.
The pattern of denominational membership among Protestants varies significantly by region. More than four in ten (44%) Protestants living in the South affiliate with a Baptist denomination, nearly twice as many as those living in the Northeast (23%), Midwest (23%), or West (19%). Lutherans remain much more prevalent in the Midwest than any other part of the country. Seventeen percent of Protestants living in the Midwest are Lutheran, roughly twice the number who identify with this denomination in the West (9%) and the Northeast (7%). Only three percent of Southerners are Lutheran. Non-denominational Protestants are more prevalent in the West (25%) than the Midwest (17%), South (15%), or Northeast (14%).
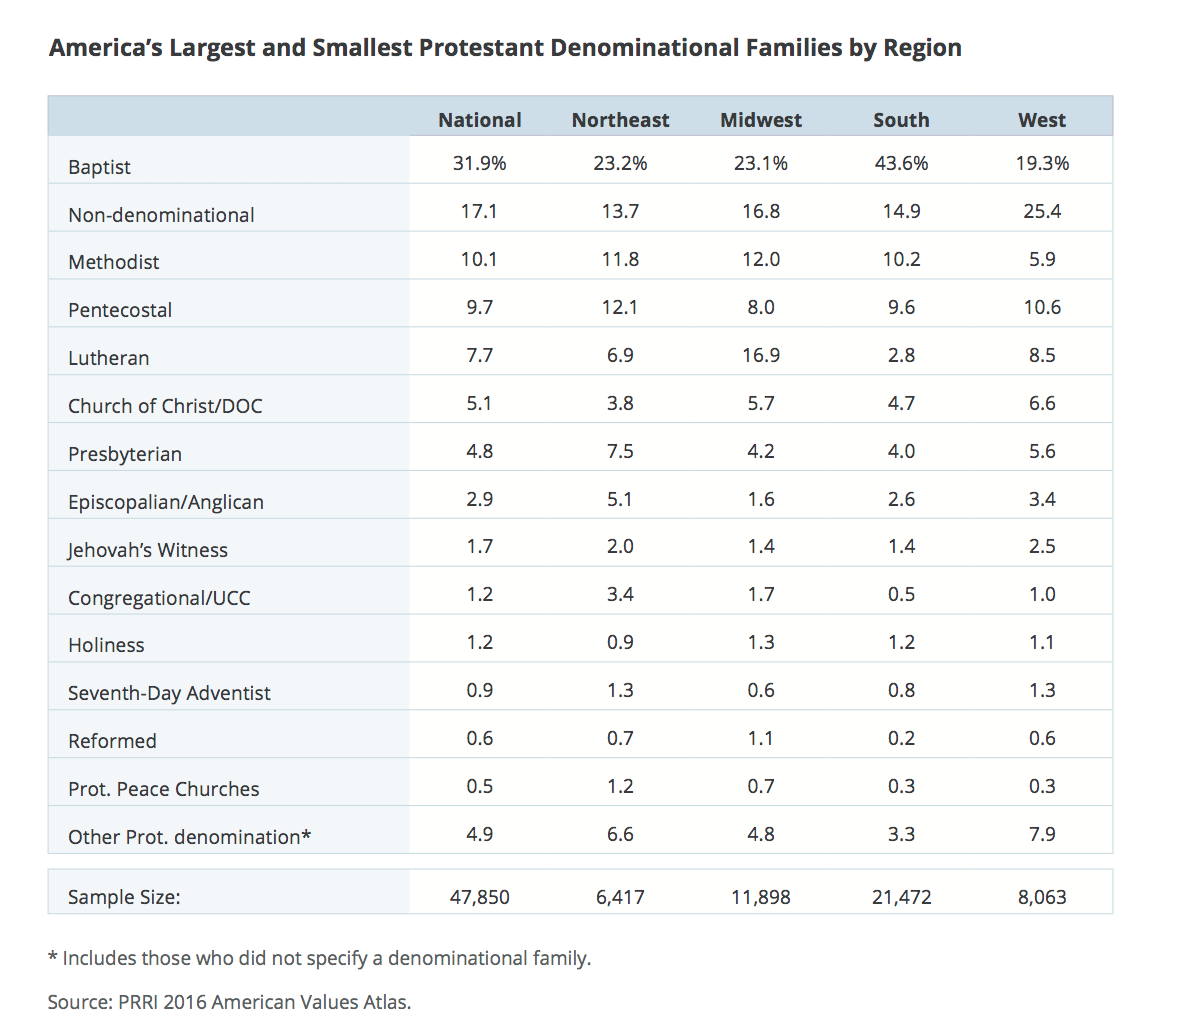
Certain states are also unique in that they are dominated by one denominational family. A majority of Protestants in Mississippi (60%), Arkansas (56%), Louisiana (55%), and Alabama (54%) are Baptist, while a majority of Protestants in North Dakota (56%) and nearly half of those in Minnesota (49%) are Lutheran.
Jewish Identity and Denominations
Overall, 1.5% of Americans identify as Jewish when responding to a question about their religious affiliation. However, previous research has suggested questions that frame Jewish identity in explicitly religious terms may undercount the total Jewish population because they miss those with a cultural or familial affinity. To address this issue, the survey included a question to identify those who had a cultural rather than a religious connection to their Jewish identity.3 An additional 0.8% of Americans identify as culturally but not religiously Jewish.
The issue of Jewish cultural identity has become increasingly important as younger Jews are more likely to have a cultural affinity. Among Jews under the age of 30, fewer than half (47%) identify as religiously Jewish, while a majority (53%) identify as culturally Jewish. In sharp contrast, more than three-quarters (78%) of Jewish seniors (age 65 or older) are religiously Jewish, while 22% identify as culturally Jewish.
Among all Jewish Americans—those who identify as Jewish both religiously and culturally—more identify as Reform than any other denomination. Twenty-eight percent of Jews identify as Reform, compared to 14% who identify as Conservative and 10% who identify as Orthodox. Two percent identify as Reconstructionist. Notably, more than one-third (37%) of Jewish Americans claim to be “just Jewish” when asked about their denominational affiliation. There is, however, a considerable disparity in denominational membership among Jews by age.
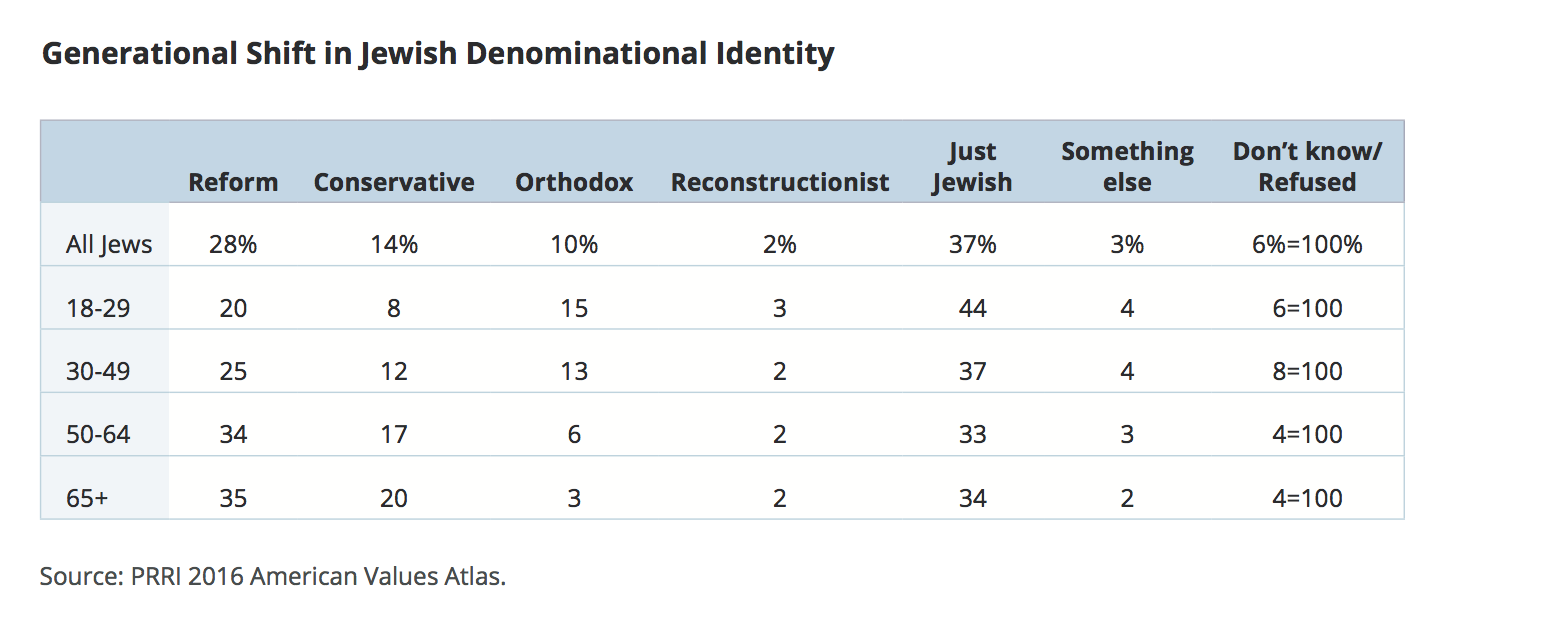
Only 20% of Jews under the age of 30 are Reform, compared to 15% who identify as Orthodox. Fewer than one in ten (8%) young Jewish Americans affiliate with the Conservative movement, and three percent identify as Reconstructionist. More than four in ten (44%) say they are “just Jewish” in terms of their denominational affinity. Jewish seniors are about ten times as likely to identify as Reform as they are to identify as Orthodox (35% vs. 3%, respectively). One in five (20%) identify as Conservative, and two percent identify as Reconstructionist. Approximately one-third (34%) do not claim any denominational affiliation.
Measuring Evangelical Protestant Identity
The size of the white evangelical Protestant population in the U.S. has often been misunderstood in recent years. The primary source of confusion stems from researchers employing differing definitions of “evangelical” and their published findings often failing to clearly distinguish between the group as a whole and the distinct racial and ethnic subgroups within it. In this report, “evangelicals” are defined as those who self-identify as Protestant Christians who also identify as evangelical or born again.5
Self-identified evangelical Protestants account for more than one-quarter (26%) of the public, but whites make up only a subset of this larger group. Fewer than two-thirds (64%) of all evangelical Protestants are white. Nearly one in five (19%) are black, one in ten (10%) are Hispanic, and six percent identify as some other race or mixed race.
Thus, among the public overall, white evangelical Protestants account for fewer than one in five (17%) Americans. Five percent of Americans are black evangelical Protestants, two percent are Hispanic evangelical Protestants, and other or mixed-race evangelical Protestants make up one percent of the public.
Like all Christians in the U.S., evangelical Protestants are experiencing a substantial racial and ethnic transformation. Young evangelical Protestants are far more racially and ethnically diverse than previous generations. Only half (50%) of evangelical Protestants under the age of 30 are white, compared to more than three-quarters (77%) of evangelical Protestant seniors (age 65 or older). Twenty-two percent of young evangelical Protestants are black, 18% are Hispanic, and nine percent identify as some other race or mixed race.
III. America’s New Religious Landscape: Three Major Trends
The National Decline in White Christian Identity
Demographically, the U.S. historically has been an overwhelmingly white Christian country, with white Protestants alone constituting a clear cultural majority.6 In 1976, roughly eight in ten (81%) Americans identified as white and identified with a Christian denomination. At that time, a majority (55%) of Americans were white Protestants.
Much of the decline has occurred in the last few decades. As recently as 1996, white Christians still made up nearly two-thirds (65%) of the public. By 2006, that number dropped to 54%, but white Christians still constituted a majority.8 But over the last decade, the proportion of white Christians in the U.S. has slipped below majority. Today, only 43% of Americans identify as white and Christian—and only 30% as white and Protestant.
Although white Christians have experienced substantial losses nationally, there are notable divisions in the size of the white Christian population by state. Today, the states with the highest concentrations of white Christians are generally found in the Midwest and Appalachia, including North Dakota (71%), South Dakota (68%), Iowa (64%), West Virginia (61%), Kentucky (61%), Utah (61%), Minnesota (59%), Missouri (58%), and Arkansas (58%). Conversely, white Christians are least plentiful in Hawaii (20%), California (24%), New York (30%), New Mexico (30%), and Maryland (32%).
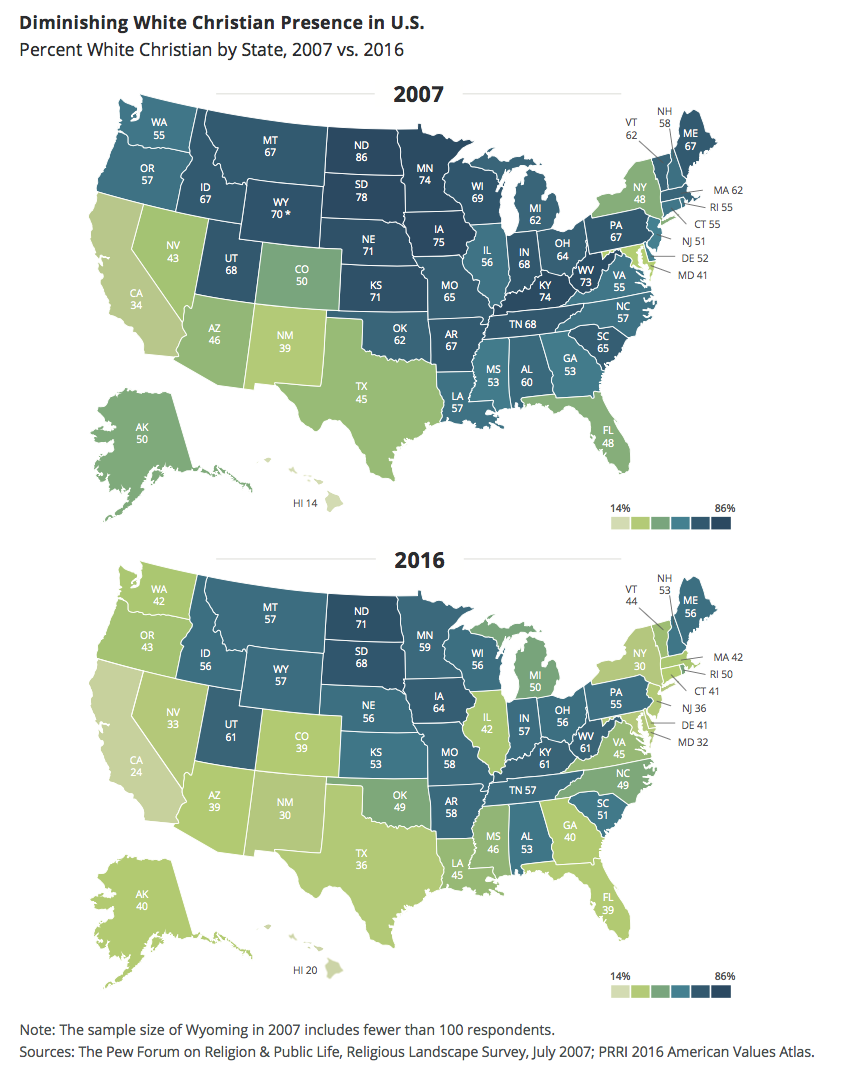
In total, fewer than half (23) of all 50 states have majority white Christian populations. This represents a significant drop from 2007, when 39 states had majority white Christian populations.9
Notably, between 2007 and 2016, the proportions of white Christians have declined in every state but one (Hawaii), though the amount of decline varies widely by state. Many of the states that experienced the greatest losses are concentrated in the Northeast. Massachusetts, for example, experienced a 20-point decline in the number of white Christians living in the state over the last decade. Hawaii, the only state to experience an increase in the proportion of white Christians, saw an increase of six percentage points.
The Decline of White Evangelical Protestants
Although much of the research on religious decline has focused on losses among white mainline Protestants and white Catholics—groups with well-documented declines—much of the public discussion on religious change has missed one of the most important stories of the last decade: The decline of white evangelical Protestants.10
The Decline of White Christians, 2006 – 2016
Long description.
Structure.
Religion and Public Life Survey, 2006-2009; PRRI 2010 American Values Survey; PRRI/Brookings 2011 Pluralism Survey;
PRRI 2012 American Values Survey; PRRI 2013-2016 American Values Atlas..
Chart graphic.
White evangelicals managed to avoid the first wave of white Christian decline in the 1990s and into the early years of the 21st century. But between 2006 and 2016, the proportion of white evangelical Protestants has fallen six percentage points, from 23% to 17%. White Catholics experienced a similar decline in membership, dropping five percentage points from 16% in 2006 to 11% in 2016.11 White mainline Protestants also experienced significant losses during this period, dropping from 18% in 2006 to 13% in 2016.
The Aging of White Christians
White Christians are not only declining, they are aging. Only slightly more than one in ten white evangelical Protestants (11%), white Catholics (11%), and white mainline Protestants (14%) are under the age of 30. Approximately six in ten white evangelical Protestants (62%), white Catholics (62%), and white mainline Protestants (59%) are at least 50 years old.
Rise of the Religiously Unaffiliated
The religiously unaffiliated—those who identify as “atheist,” “agnostic,” or “nothing in particular”—now account for nearly one-quarter (24%) of Americans. Since the early 1990s, this group has roughly tripled in size.
Growth of the Religiously Unaffiliated, 1976-2016
Long description.
Structure.
Chart graphic.
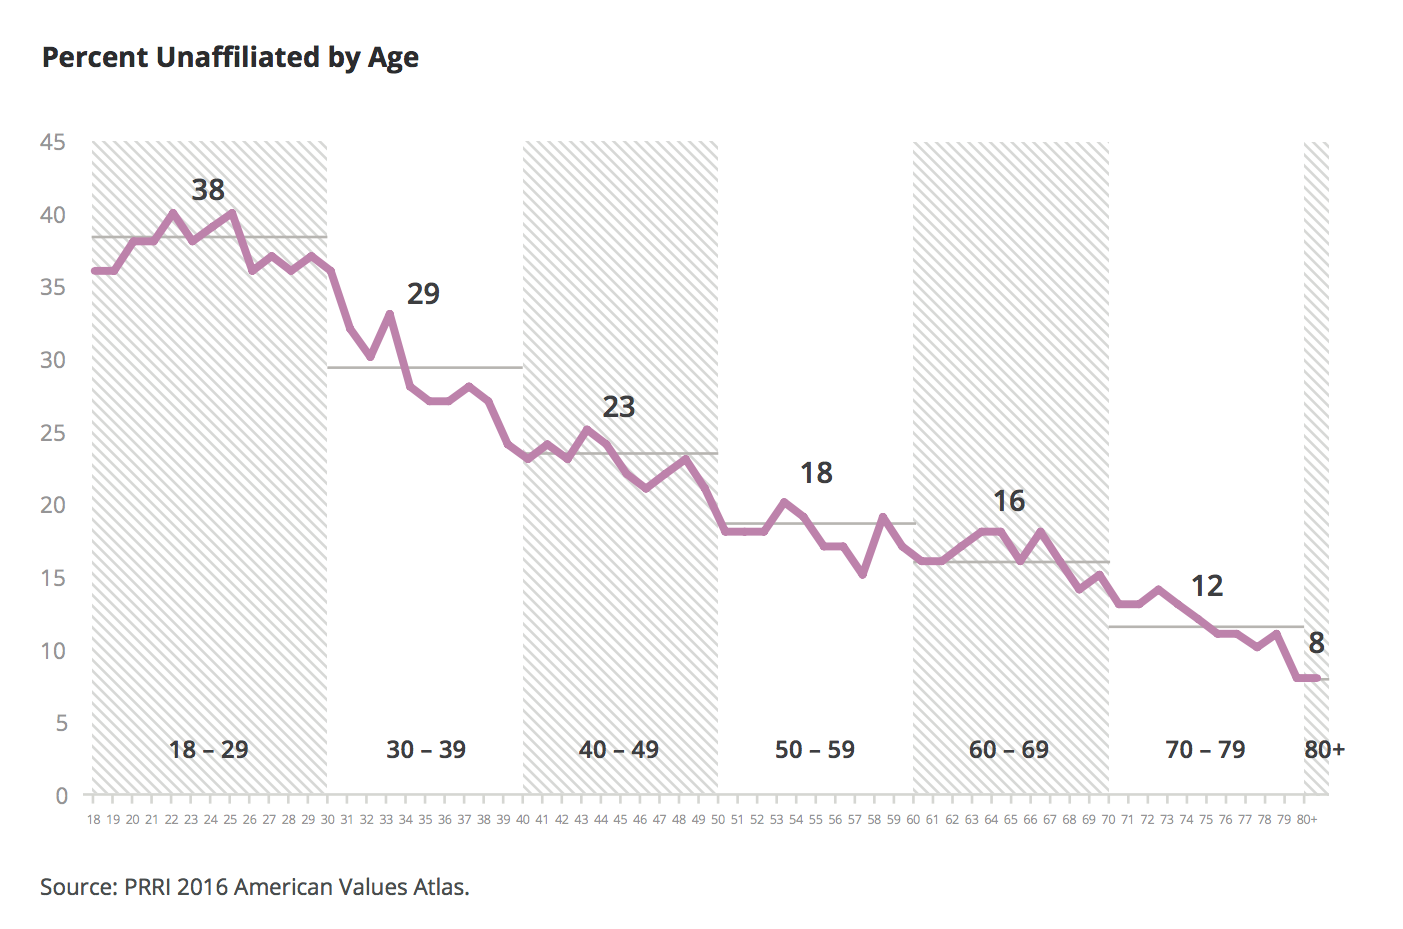
Religious identity is highly stratified by age, with younger Americans (age 18-29) most likely to be religiously unaffiliated and seniors (age 65 or older) least likely to identify this way. However, the relationship between age and unaffiliated status is not completely linear. While there is considerable variation at the youngest and oldest ends of the age spectrum, there is less variation in the rate of unaffiliated identity among Americans in their 40s (23%), 50s (18%), and 60s (16%).
Although unaffiliated Americans tend to be younger than religiously affiliated Americans on average, the group collectively is older today than it was a generation ago. Today, about one-third (34%) of unaffiliated Americans are under the age of 30, while nearly three in ten (29%) are at least 50 years old. In the 1970s, half (50%) of all unaffiliated Americans were under 30 years old, and only 17% were age 50 or older. The median age of someone who was unaffiliated during that decade was also seven years younger than it is today: 29 vs. 36, respectively.
Atheists, Agnostics, Seculars, and the Religiously Unattached
There are notable differences among the unaffiliated in terms of their religious identity. Only about one-quarter of the unaffiliated identify as atheist (14%) or agnostic (13%), while fewer than one in five (16%) identifies as a “religious person.” The majority (58%) of Americans who are not religiously affiliated do not identify as a religious person.18
Economic Status
Household income
Religious groups with the lowest levels of household incomes tend be Christians from racial and ethnic minority groups. More than four in ten black Protestants (43%), Hispanic Protestants (45%), Jehovah’s Witnesses (45%), and Hispanic Catholics (49%) report household earnings of less than $30,000 per year.
White Christian groups report higher levels of income. Fewer than one-third of white evangelical Protestants (28%), Mormons (26%), white mainline Protestants (22%), and white Catholics (19%) have household incomes of less than $30,000 per year.
Among non-Christian groups, Muslims report the lowest levels of household income. Nearly four in ten (38%) Muslims have household incomes of less than $30,000 per year, compared to fewer than one-third of Buddhists (31%), Hindus (20%), and Jews (16%). One-quarter (25%) of Hindus and 30% of Jewish Americans have annual household incomes in excess of $100,000. Unitarians-Universalists are also fairly well off financially. Only 18% report living in households making less than $30,000 annually, and 22% report having incomes exceeding $100,000.
The income levels of religiously unaffiliated Americans closely mirror Americans overall.
Home Ownership
Patterns of homeownership vary considerably among religious groups. Roughly three-quarters of white Catholics (78%), white evangelical Protestants (75%), and white mainline Protestants (75%) report they own their home. About two-thirds (66%) of Mormons say they own rather than rent.
Nonwhite Christians are far less likely to report owning their home. Fewer than half of Jehovah’s Witnesses (48%), black Protestants (46%), Hispanic Catholics (38%), and Hispanic Protestants (38%) are homeowners.
Among non-Christian groups, Jewish Americans (69%) are much more likely than Buddhists (54%), Muslims (36%), or Hindus (31%) to own their home. More than seven in ten (72%) Unitarian-Universalists own their home. A majority (54%) of religiously unaffiliated Americans are homeowners.
Health Insurance Status
A slim majority (51%) of white Catholics and close to half of Mormons (48%) and white mainline Protestants (46%) report they receive health insurance through their employer. More than four in ten (43%) white evangelical Protestants say they have employer-based health insurance. Three in ten (30%) white evangelical Protestants have government-sponsored health care such as Medicare or Medicaid, while fewer white mainline Protestants (27%), white Catholics (25%), and Mormons (22%) report the same.
Nonwhite Christians are much less likely to have employer-based health insurance than white Christians, but there are notable differences in patterns of coverage among these groups. About one-third of black Protestants (35%), Hispanic Protestants (31%), Jehovah’s Witnesses (31%), and Hispanic Catholics (29%) report having health insurance through their employer. Jehovah’s Witnesses (33%) and black Protestants (30%) are more likely to receive health insurance through government programs than Hispanic Protestants (21%) and Hispanic Catholics (23%). But nearly one-third of Hispanic Protestants (29%) and Hispanic Catholics (32%) report they have no health insurance coverage at all.
No group is more likely to receive health insurance through their employer than Hindus. More than six in ten (62%) Hindus have employer-sponsored health care coverage. Fewer than half (47%) of Jewish Americans, four in ten (40%) Buddhists, and nearly three in ten (29%) Muslims receive health insurance through an employer. Hindus are also far less likely to receive health care through government programs, such as Medicare or Medicaid, with only six percent reporting they receive this type of coverage. In contrast, at least one in five Buddhists (21%), Muslims (25%), and Jews (25%) have government-sponsored health insurance. Nearly one in five (19%) Muslims report having no health insurance coverage.
The health care insurance status of religiously unaffiliated Americans closely resembles that of Americans overall. Four in ten (43%) receive it through an employer, while 19% report receiving it through the government. Fifteen percent have no health insurance.
Approximately four in ten (43%) Unitarian-Universalists also receive their health insurance through an employer, while close to one-third (29%) have government-sponsored coverage. Only four percent of Unitarian-Universalists report having no health insurance at all.
Text & Graphics Courtesy: https://www.prri.org
Read Whole Report Here : https://www.prri.org/research/american-religious-landscape-christian-religiously-unaffiliated/

Editorial Review Note
Religion World is the country's only website that provides complete information on all religions. Religion World will always present information about all religions impartially. You can send us all kinds of information, news, updates, opinions, and suggestions at religionworldin@gmail.com.You can also follow us on X (Twitter), Facebook, and YouTube.
Leave a Reply